Post is also uploaded at HackMD. Check it out.
Prerequisite
- Windows 10 or later
- IDA Pro 7.x or later
- VMware Player 17.x or later, or virt-manager with QEMU/KVM
For unsigned drivers
Before we start, let’s talk about unsigned drivers. We cannot load unsigned drivers into our Windows kernel, because of Driver Signing Enforcement (DSE). So, we should sign a driver before we talk about the topic.
Of course, there is no problem if driver don’t uses their DriverObject parameter on DriverEntry. The popular project kdmapper uses vulnerable driver for loading unsigned drivers, bypassing DSE. However, if you load your driver with the project, DriverObject parameter is set to NULL. So in many cases, your driver should crash and end up loading BSOD.
Luckily you can make a test sign for any drivers, you can load the driver if OS has booted in test mode.
Creating Root Certificate
First, let’s make a TestCert test sign and store it in Localmachine\My.
New-SelfSignedCertificate -Type CodeSigningCert -Subject "CN=TestCert" -CertStoreLocation "Cert:\LocalMachine\My"Next, we’ll load our sign to CTLs, which is in LocalMachine\Root.
$cert = Get-ChildItem -Path Cert:\LocalMachine\My | Where-Object { $_.Subject -eq "CN=TestCert" }
Export-Certificate -Cert $cert -FilePath TestCert.cer
Import-Certificate -FilePath TestCert.cer -CertStoreLocation Cert:\LocalMachine\Root
This will generate TestCert.cer in your current directory, and will register into LocalMachine\Root.
Lastly, we sign our driver with TestCert with signtool.
signtool sign /v /n "TestCert" /fd SHA256 /tr http://timestamp.digicert.com /td SHA256 Driver.sysBoom! We can now load Driver.sys with test sign.
Opening GDBStub
VMware
We can debug entire Windows on VMware, using GDBStub. VMware supports GDBStub debugging, of course they work for other OS!
Add these two lines to your .vmx files:
debugStub.listen.guest64.remote = "TRUE"
monitor.debugOnStartGuest64 = "TRUE"
So you can debug on boot time. You can now load your IDA by connecting default port :8864. You can use Remote GDB Debugger option in IDA.

virt-manager
I recommend this method, as this uses qemu, and it is more developer-friendly. The debugging process is going to be more comfortable.
modify the first:
+ <domain xmlns:qemu="http://libvirt.org/schemas/domain/qemu/1.0" type="kvm">
- <domain type="kvm">
and add these to end of settings:
+ <qemu:commandline>
+   <qemu:arg value="-s"/>
+ </qemu:commandline>
now launch with this shell script (the -S option is somewhat not working, so we need to do this way):
virsh -c qemu:///system start win11
virsh -c qemu:///system qemu-monitor-command win11 --hmp 'stop'
You can now connect to the VM with default port :1234. You can do as same as VMware.
Finding NT kernel base address
You should now locate NT kernel’s base address. Unfortunately your debugging is starting from boot time, you should use clever approach.
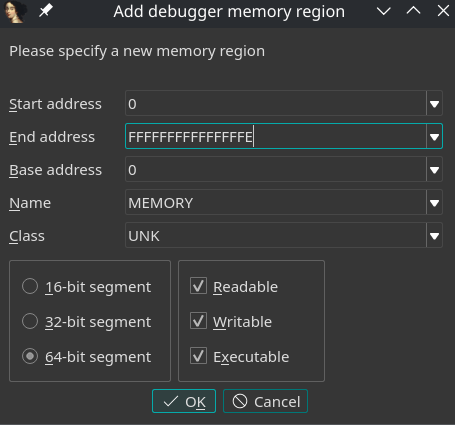
First, map the memory area so we can locate or jump to specific address.

Next, we exploit KUSER_SHARED_DATA. there are references in very beginning on kernel initialization, so we add hardware breakpoint at the structure.
import ida_dbg
import ida_idd

if ida_dbg.add_bpt(0xFFFFF78000000000, 8, ida_idd.BPT_RDWR) == False:
    raise RuntimeError("Failed to set breakpoint")

ida_dbg.continue_process()
Our RIP is on somewhere in kernel, so now we can use backwalking technique to find NT kernel base.
import idaapi
import ida_dbg

# ida_dbg.del_bpt(0xFFFFF78000000000) # Optional

def page_align(address):
    return (address&~(0x1000-1))

MODE = "QEMU"
if MODE == "VMWARE":
    monitor_result = send_dbg_command("r idtr")
    base_pos = monitor_result.find("base=")
    limit_pos = monitor_result.rfind(" limit")
    idt_base = monitor_result[base_pos+5:limit_pos]
    idt_base = int(idt_base, 16)
elif MODE == "QEMU":
    kgs = idaapi.get_reg_val("k_gs_base")
    pcr = read_dbg_qword(kgs+0x18) # gs:[0x18] = KeGetPcr
    idt_base = read_dbg_qword(pcr+0x38) # pcr[0x38] = Idt entries
else:
    raise ValueError("invalid mode")

i0e_low = read_dbg_word(idt_base)
i0e_mid = read_dbg_word(idt_base+0x6)
i0e_high = read_dbg_dword(idt_base+0x8)
idt_zero_entry = (i0e_low) | (i0e_mid << 16) | (i0e_high << 32)
print(f"IDT 0th handler: {hex(idt_zero_entry)}")

DosHeader = page_align(idt_zero_entry)
while(True):
    e_magic = read_dbg_word(DosHeader+0)
    if e_magic == 0x5A4D:
        print("Base address located at {}".format(hex(DosHeader)))
        break
    DosHeader -= 0x1000

e_lfanew = read_dbg_dword(DosHeader+0x3c)
if read_dbg_dword(DosHeader+e_lfanew) != 0x4550:
    raise ValueError("couldnt verify pe")

opt_offset = DosHeader+e_lfanew+0x18
if read_dbg_word(opt_offset) != 0x20b:
    raise ValueError("couldnt verify pe+")
We could find our base address.
IDT 0th handler: 0xfffff80585caf700
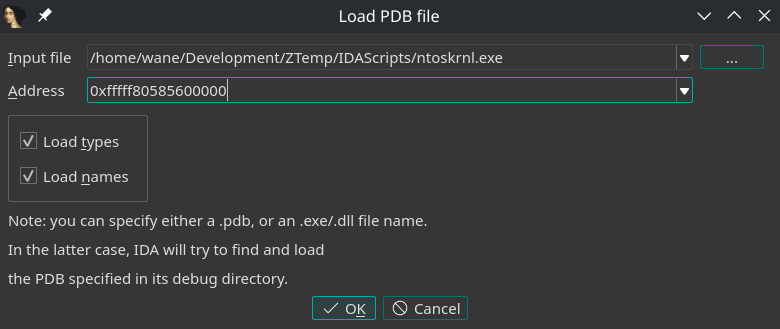
Base address located at 0xfffff80585600000
Load Symbol
We can now load our symbol into our kernel:

Analyze
Now we should set breakpoint on our driver’s entry when we load it. It is well known that you run sc start, it calls NtLoadDriver, subsequently IopLoadDriver, and finally PnpCallDriverEntry. We’ll put a breakpoint on PnpCallDriverEntry.

Now go in through KscpCfgDispatchUserCallTargetEsSmep, (…or some related to _guard_dispatch_icall_no_overrides.) After some step in execution, you can find driver entry!

After this, you can now calculate base, and place breakpoint, etc, yeah.
Used kernel driver
In this post, I used a Dreamhack challenge named Windows Surprise Event, which is made by Zoodasa. I recommend you to see this challenge!
Exercise: kdmapper
For some drivers, they are required to loaded with kdmapper. Of course you can debug them with this method.
This is an appendix for this post, as your exercise.
Conclusion
It has some advantages, like it do not trigger cli or sti instruction, Kd flags, etc because it is working with VM-exit tricks. (DR movement hypervisor handling) So you can debug any windows kernel stuff stealthily unless they have hypervisor detections.
The debugging method is very effective to many situations, such as you don’t have any helpers but only one kernel driver, analyzing boot-time loading drivers, or even analyzing the kernel itself! (It is very useful to analyze PatchGuard yes.)

